Case study
Live fleet dashboard
The web app bus operators keep open all day. Every vehicle on a live map, every service on a timeline, faults and alerts as they happen, and a replay that shows exactly what a bus did and when. I built the frontend in Vue.js.

Why it exists
Every bus on the network keeps reporting where it is and what it's doing. The control room needs that turned into something they can act on: which services are running late, which vehicles have a fault, and where everyone is right now.
And when something goes wrong, like a complaint, a missed stop or a detour, they need to go back and see what really happened, not guess.
The timeline
The lines view puts every service of the day on a timeline, grouped by line and direction. Green is on time, red is late, and a dashed line marks the current time, so a supervisor can scan the whole network in a few seconds. A slider zooms in or out of the day.
The live map
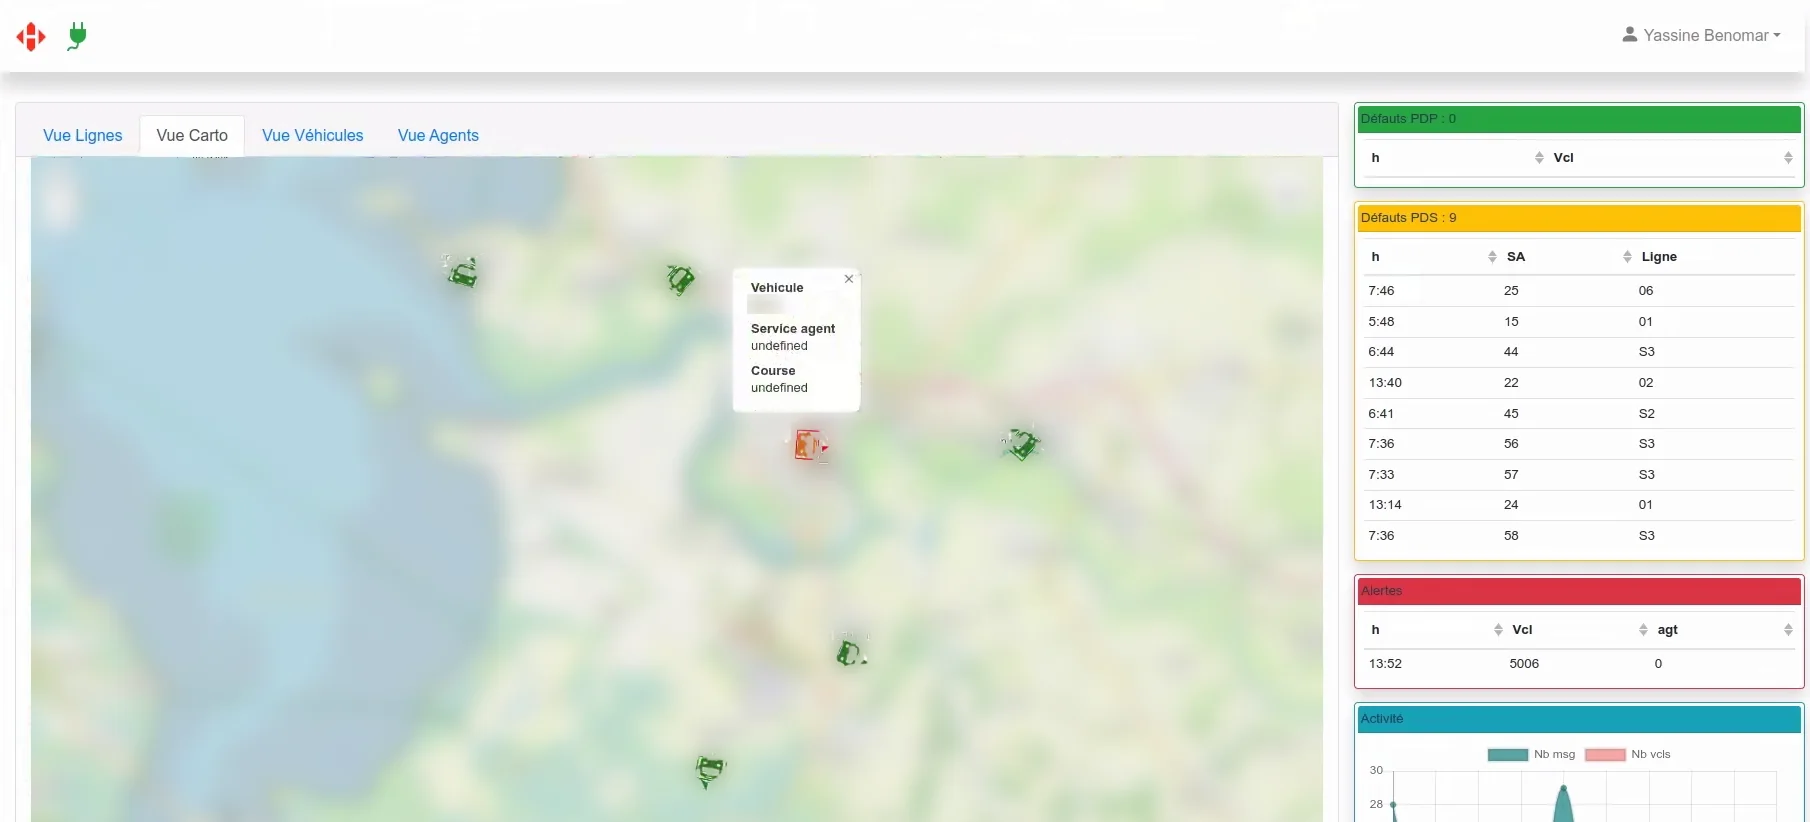
The map shows every vehicle in real time. Click a bus to see its current service and driver. The panels on the right stay put across every view: faults, alerts, and a chart of how much the fleet is talking to the server.
The replay
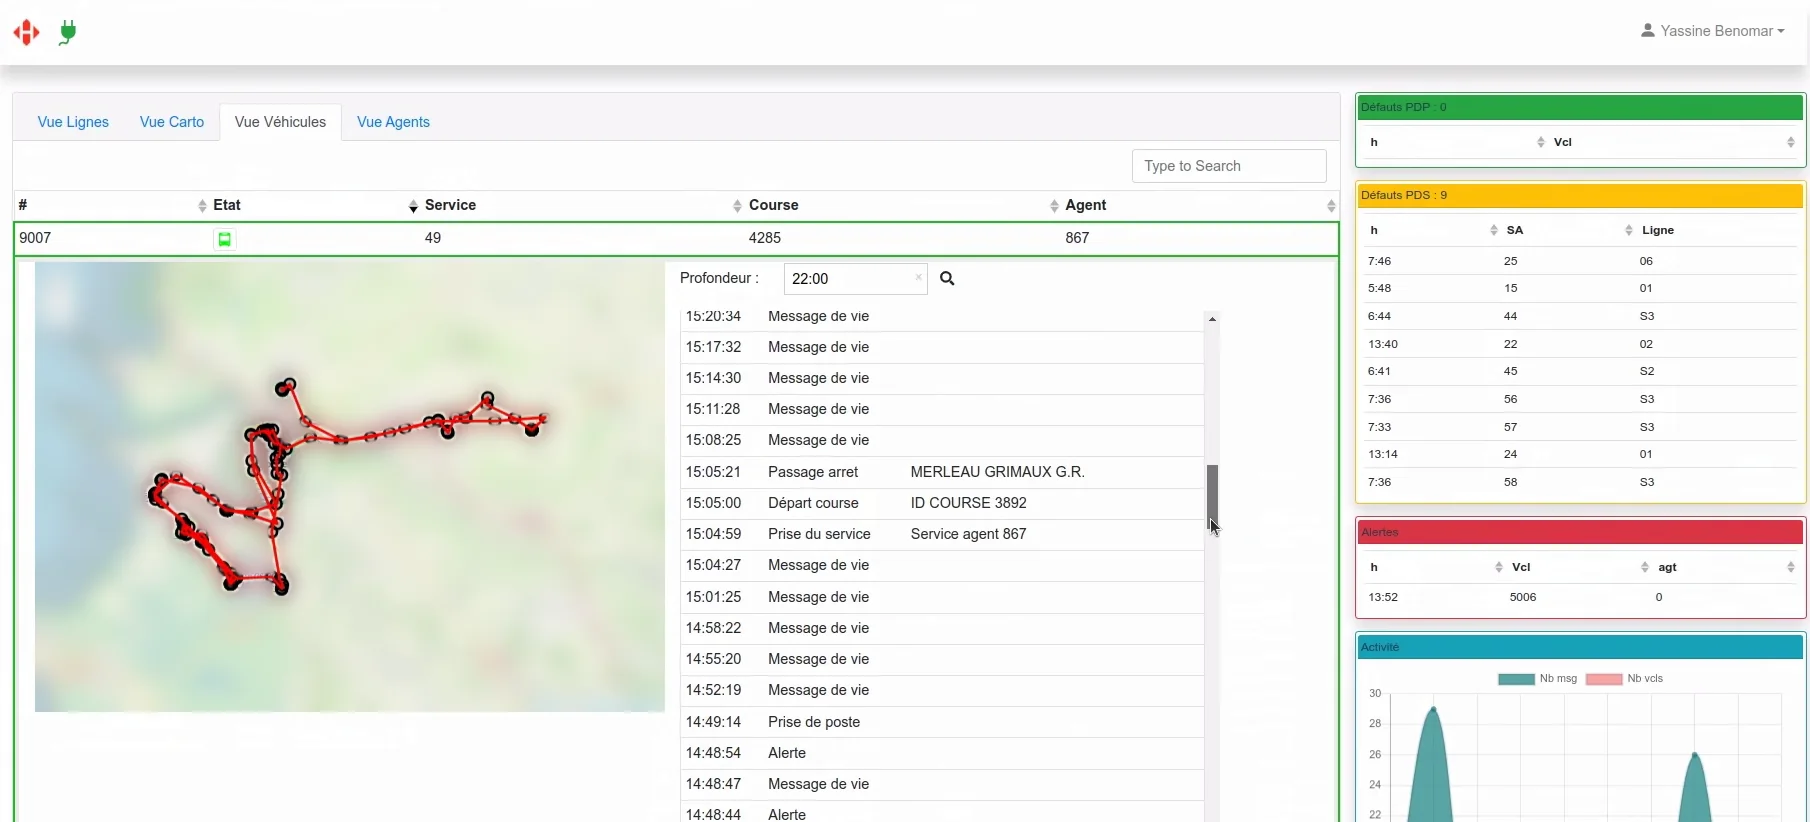
My favourite part. Pick a vehicle and how far back to look, and the dashboard redraws its route on the map with every event beside it: stops served, journeys started, driver changes, alerts, detours, and the regular heartbeat messages in between.
"The bus never came" becomes a two-minute check instead of an argument.
Why it matters for you
It's a real production web app, used all day by people who aren't developers. It's also where my device work meets the control room: I know exactly what the onboard computer sends, because I write that software too.